
It's Cool to Use Excel
An Exploration of Mathematics with Spreadsheets
by
Sarah Major
This write-up is based on problem 8 in Exploration 12. It attempts to find a function for the following data:

This is data for the temperatures of a cup of water at various minutes during its cooling process, beginning with its initial temperature at x = 0.
This first aspect of this function that is easily predictable is the y-intercept. Since this is where x = 0, I can assume that the first point on the spreadsheet is the y-intercept, which is (0,212). We can think of this number as how many units all of the points in the parent function are shifted vertically since the parent function normally always has a y-intercept of 0. Therefore, to find what type of parent function this data fits, I can subtract 212 from each of the function values and obtain the following data:

Therefore, once I find what function I need, I know I need to add back 212 to my function. So far, that means I will have y = f(x) + 212.
But now I have negative values, which I would rather not work with. Therefore, I can multiply all of my points by a -1 to obtain all positive values:

But I have to account for this in my final function. Since I would need to multiply all of the function values by a -1, I will have y = - f(x) + 212.
My best bet now is to see if there is any kind of pattern from one function value to the next. So, I will find how much each point is increasing as the function progresses:

If we go point by point, there doesn’t seem to be a distinct pattern with the differences. However, as a whole, the differences do seem to decrease as the function values progress. This leads me to believe that the function should either be some type of exponential function or a logarithmic function.
Let’s think about if it were an exponential function. There would need to be some type of exponential increase or decrease in the function values. However, this really does not seem to be the case. As a whole, from the beginning of data set to the end, there is only a decrease of 82 degrees for 31 points. That’s an average rate of change of about 2.6 degrees. Therefore, an exponential function does not seem to be the best route to go in estimating this function.
Therefore, a logarithmic function seems to be the best way to go. But how do I figure out what the function would be?
For the sake of not knowing exactly where to go next, I’m going to focus on log(x) and ln(x) to see which would be the better function to use. Using the parts of the function that I already know [ y = - f(x) + 212], I’m going to calculate the following two functions along with my data points to see which would be better to work with: y = - log(x) + 212, and y = - ln(x) + 212:

I can see that the ln function produces a greater difference in function values than the log function, so I’m going to focus on ln (x) for now. My function values, however, are not decreasing at a fast enough rate with just ln (x) alone. This leads me to believe that I need to multiply these function values by some factor to make them decrease at a faster rate. Therefore, I’m going to calculate the ratios of these function values to the actual data points to see if there might be a common factor that I can work with:

These ratios look very similar. Though there is a difference of a little over 0.5 from the first data point to the last, this does not seem very significant. Therefore, I’m going to take the average of these ratios and use it as my factor. The average is approximately 1.35, so I’m going to use this as my factor. This gives me the tentative function of y = -1.35 ln (x) + 212. Let’s see how these function values compare to the actual data set:

Still not there yet. It looks like my function does not decrease at a fast enough rate. Let’s see what the difference is between the values in my tentative function and the actual data points:

Definitely way off. It looks like I might be missing a factor of about 10. Maybe if I put a factor of 10 into the function, I will have a better approximation. Let’s try y = -10.35 ln (x) + 212:

The beginning data points are really close, but as the function values progress, there becomes more and more difference between these function values and the actual data points. This leads me to believe that this type of function would not be the best fit for this data set.
It looks like there is something to the base e theory I had, but maybe I was wrong to think that a logarithmic function would be the best way to go. Maybe I should go back to the exponential theory, but instead, use e.
How does one typically find the equation for an exponential function based on a set of data? The easiest way is to use the base-intercept form. In this form, the leading coefficient is the y-intercept. So far then, I have y = 212 f(x). I know that I want to use e, so for my initial equation, I will use y = 212 e^-x. Let’s see how the function values compare to the actual data points:

Looks like it’s decreasing at way too fast of a rate. Let’s try adding a factor of 0.5 to the exponent for a function of y = 212 e^-0.5x:

That’s better but still decreasing too fast. What about 0.01:

Getting closer. What about 0.015:

This is very close. I just need a small factor to get it even closer. I’m going to try 0.016:

That’s even closer. But I still want to try to get it more exact. I’ll try 0.0163:

I think that’s as close as I’m going to get.
My function fits well with the first few data points and the last few data points. However, it doesn’t fit as well with the middle points. Maybe a different type of function would have fit the data better, but for the sake of this analysis, I would say that this is a pretty good representation of the data. Any other type of function probably would not be good for extrapolating data.
Here is a graph of the actual data points along with my function:
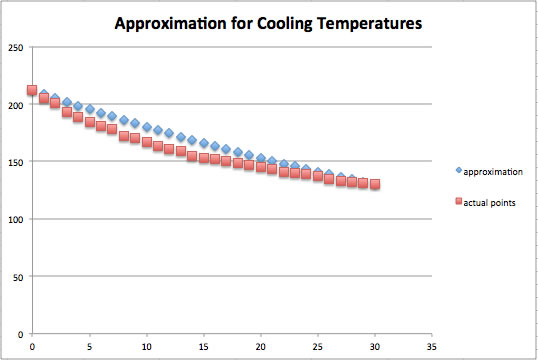
Like I said previously, it does a good job of predicting the beginning and ending points of the data set, but the middle does not do as well.
c. Using the function predict the temperature after 45 minutes, 60 minutes, or 300 minutes.
After 45 minutes, my function predicts that the temperature will be 101.807754 degrees, which seems reasonable.
After 60 minutes, my function predicts that the temperature will be 79.7252441 degrees. This is a little more than room temperature, so I suppose this is also reasonable.
After 300 minutes, my function predicts that the temperature will be 1.59454156. Not so reasonable, but I guess this is because my particular function was not meant to predict temperatures, at least of liquids.